Financial Markets Intelligence Platform
Advanced Quantitative Analysis & Portfolio Optimization for Technology Stocks

Project Synopsis
Business Objective: To develop a quantitative investment analysis platform that provides institutional investors and portfolio managers with data-driven insights for technology stock allocation and risk management.
Core Question: "Which technology stocks offer optimal risk-adjusted returns and what portfolio strategies maximize performance while managing volatility in the tech sector?"
Key Deliverable: An interactive financial intelligence dashboard with performance analytics, risk metrics, correlation analysis and technical indicators for major tech stocks.
My Role & Process:
- Quantitative Data Analysis: Processed 5+ years of high-frequency historical data for major tech stocks including TSLA, AAPL, MSFT, GOOGL, AMZN and SPY benchmark
- Advanced Performance Analytics: Calculated total returns, risk-adjusted metrics, volatility analysis, and technical indicators including 14-period RSI
- Sophisticated Risk Assessment: Analyzed historical volatility, correlation matrices, drawdown analysis, and portfolio diversification metrics
- Interactive Analytics Platform: Built comprehensive Streamlit dashboard with real-time analytics, correlation heatmaps, and technical signal visualization
Investment Performance & Returns Analysis
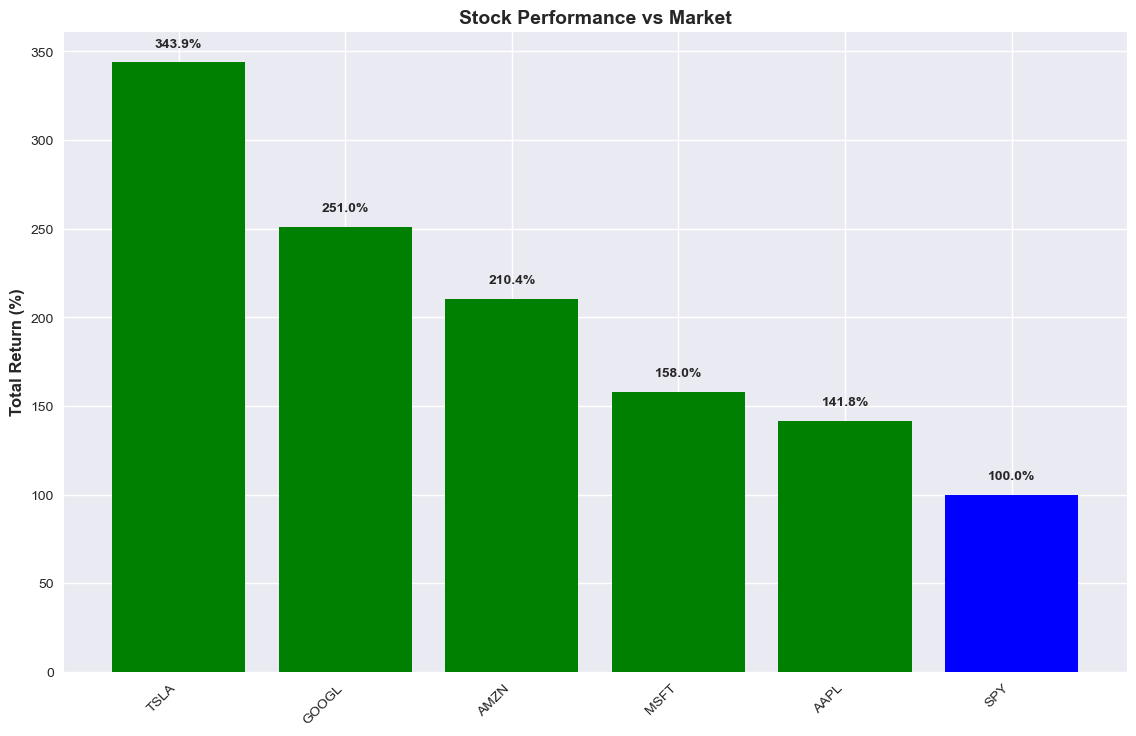
Total Return Performance
Comprehensive analysis of 5-year total returns for major technology stocks compared to SPY market benchmark, highlighting exceptional outperformance across the sector.
Key Finding: TSLA delivered extraordinary 343.9% total returns, while AAPL and MSFT achieved 141.8% and 158.0% respectively, significantly outperforming the SPY benchmark.
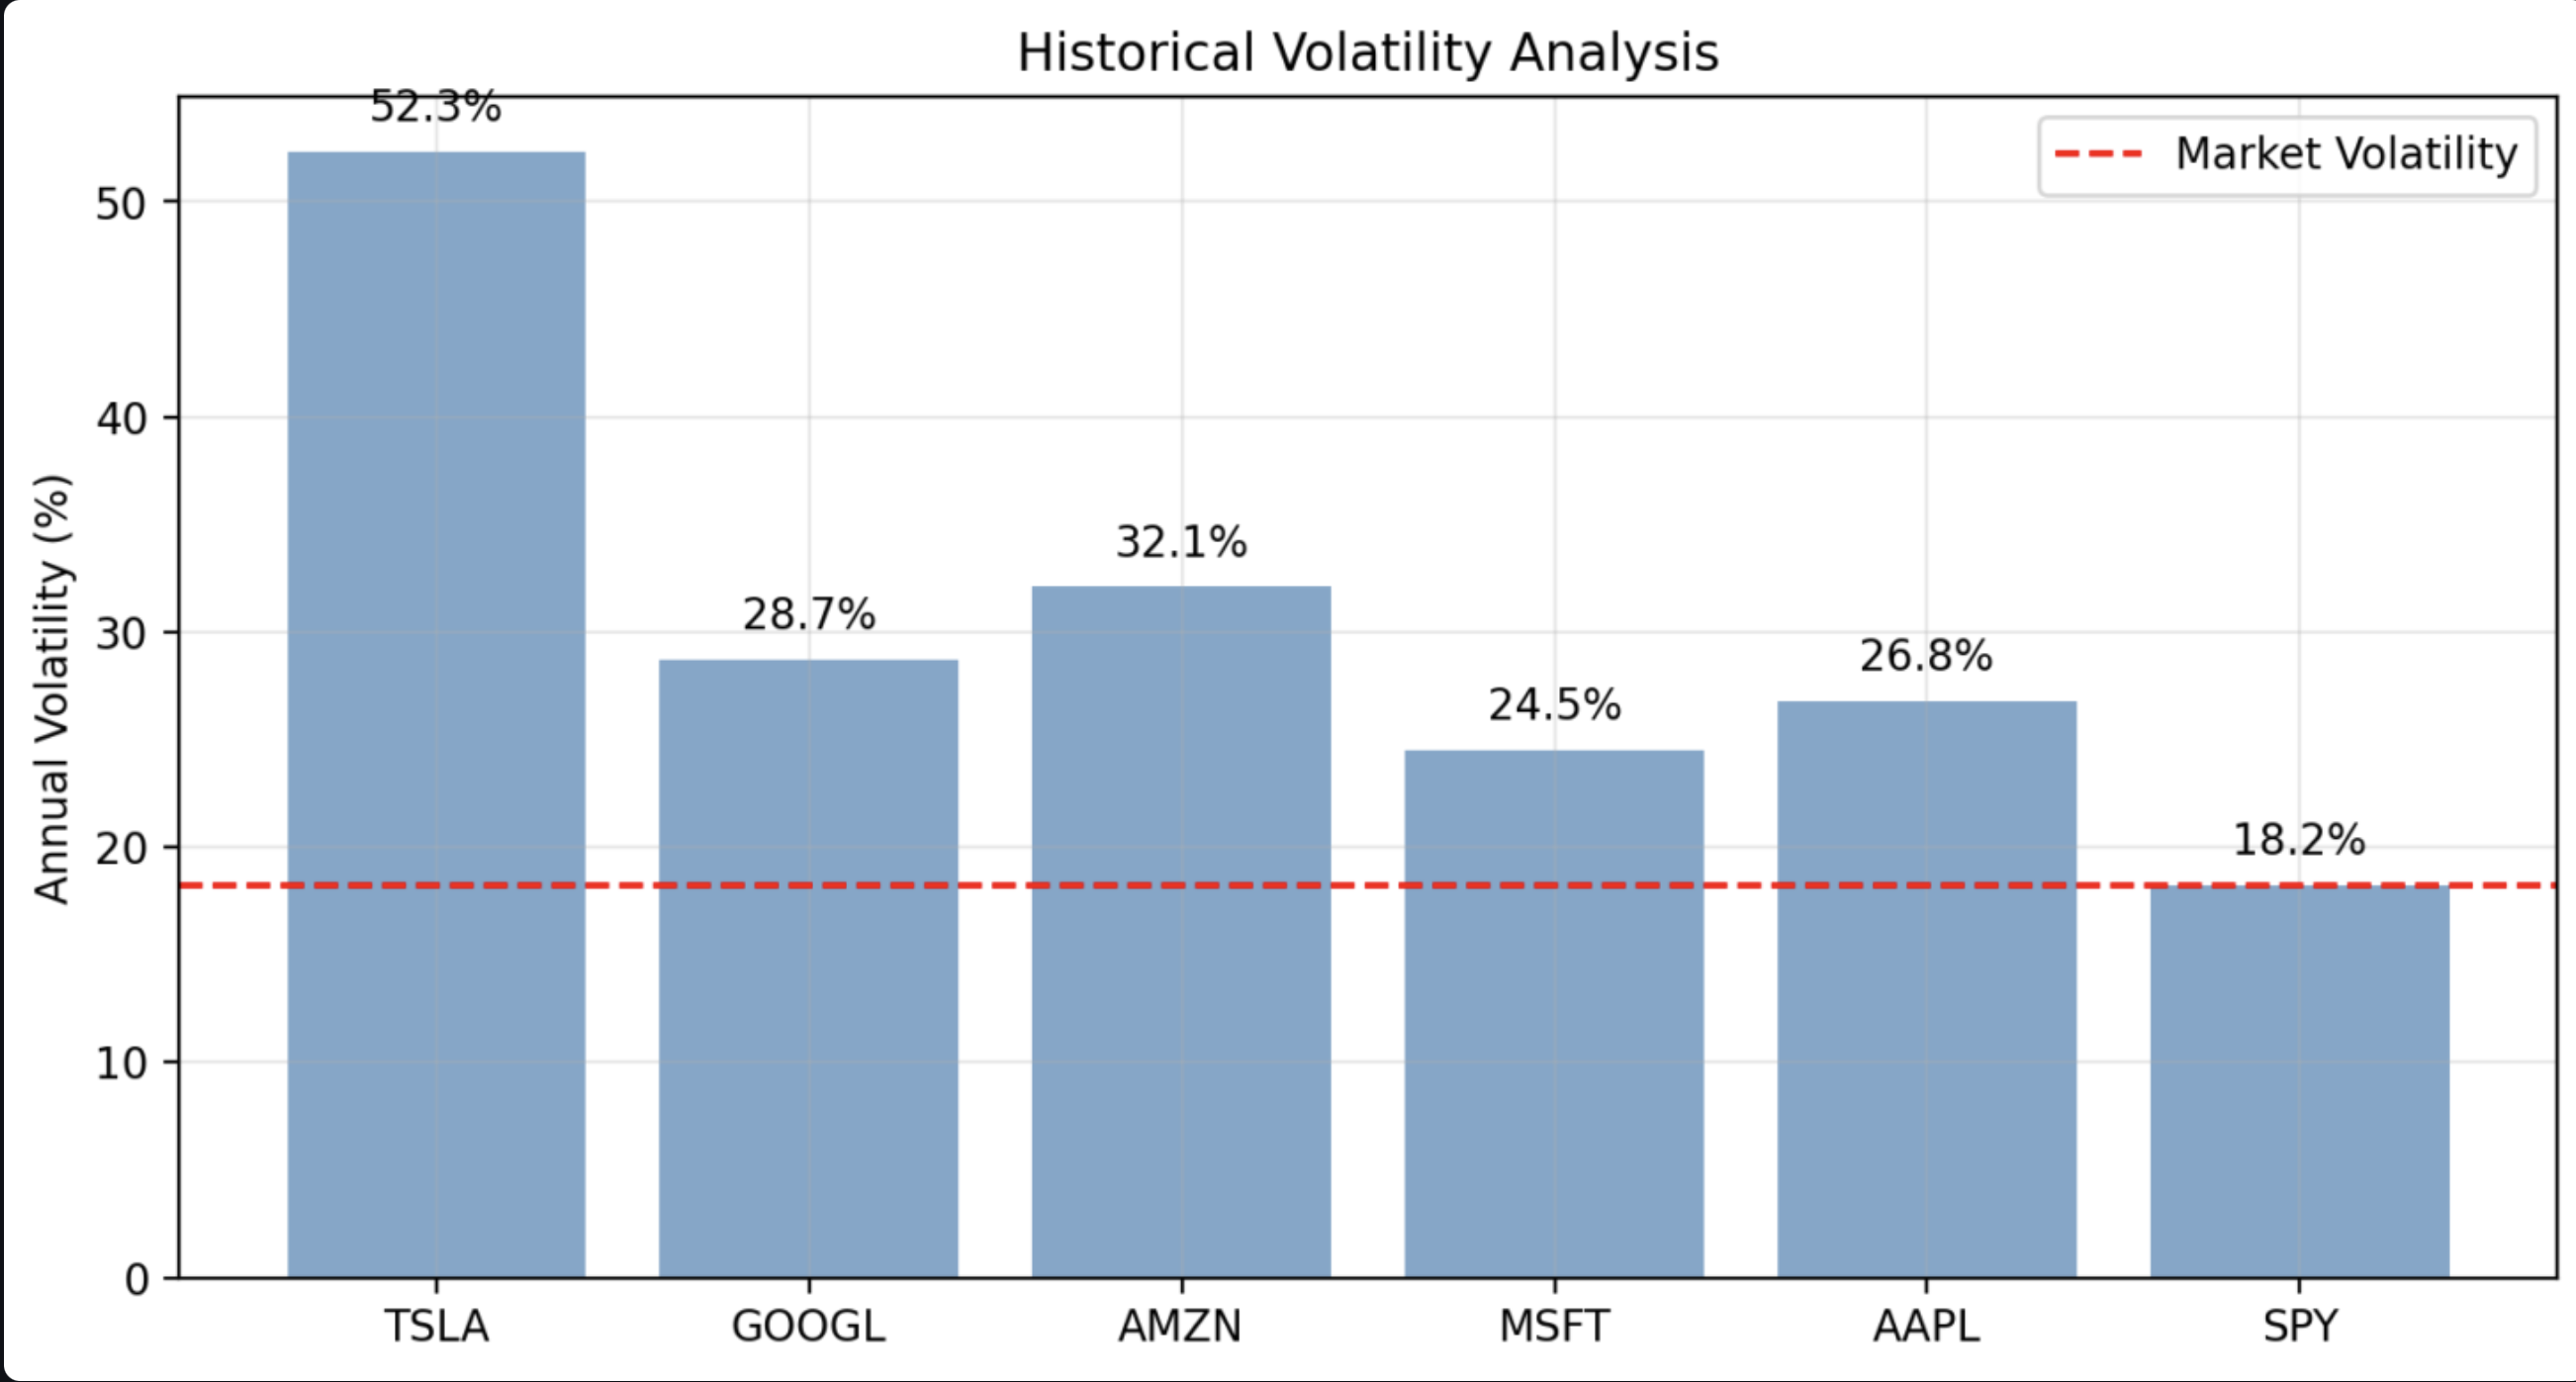
Volatility & Risk Assessment
Detailed historical volatility analysis showing annualized standard deviation of returns, providing critical insights into risk profiles and price fluctuation patterns.
Key Finding: TSLA exhibited highest volatility at 52.3%, while MSFT showed moderate volatility of 24.5% with strong risk-adjusted returns.
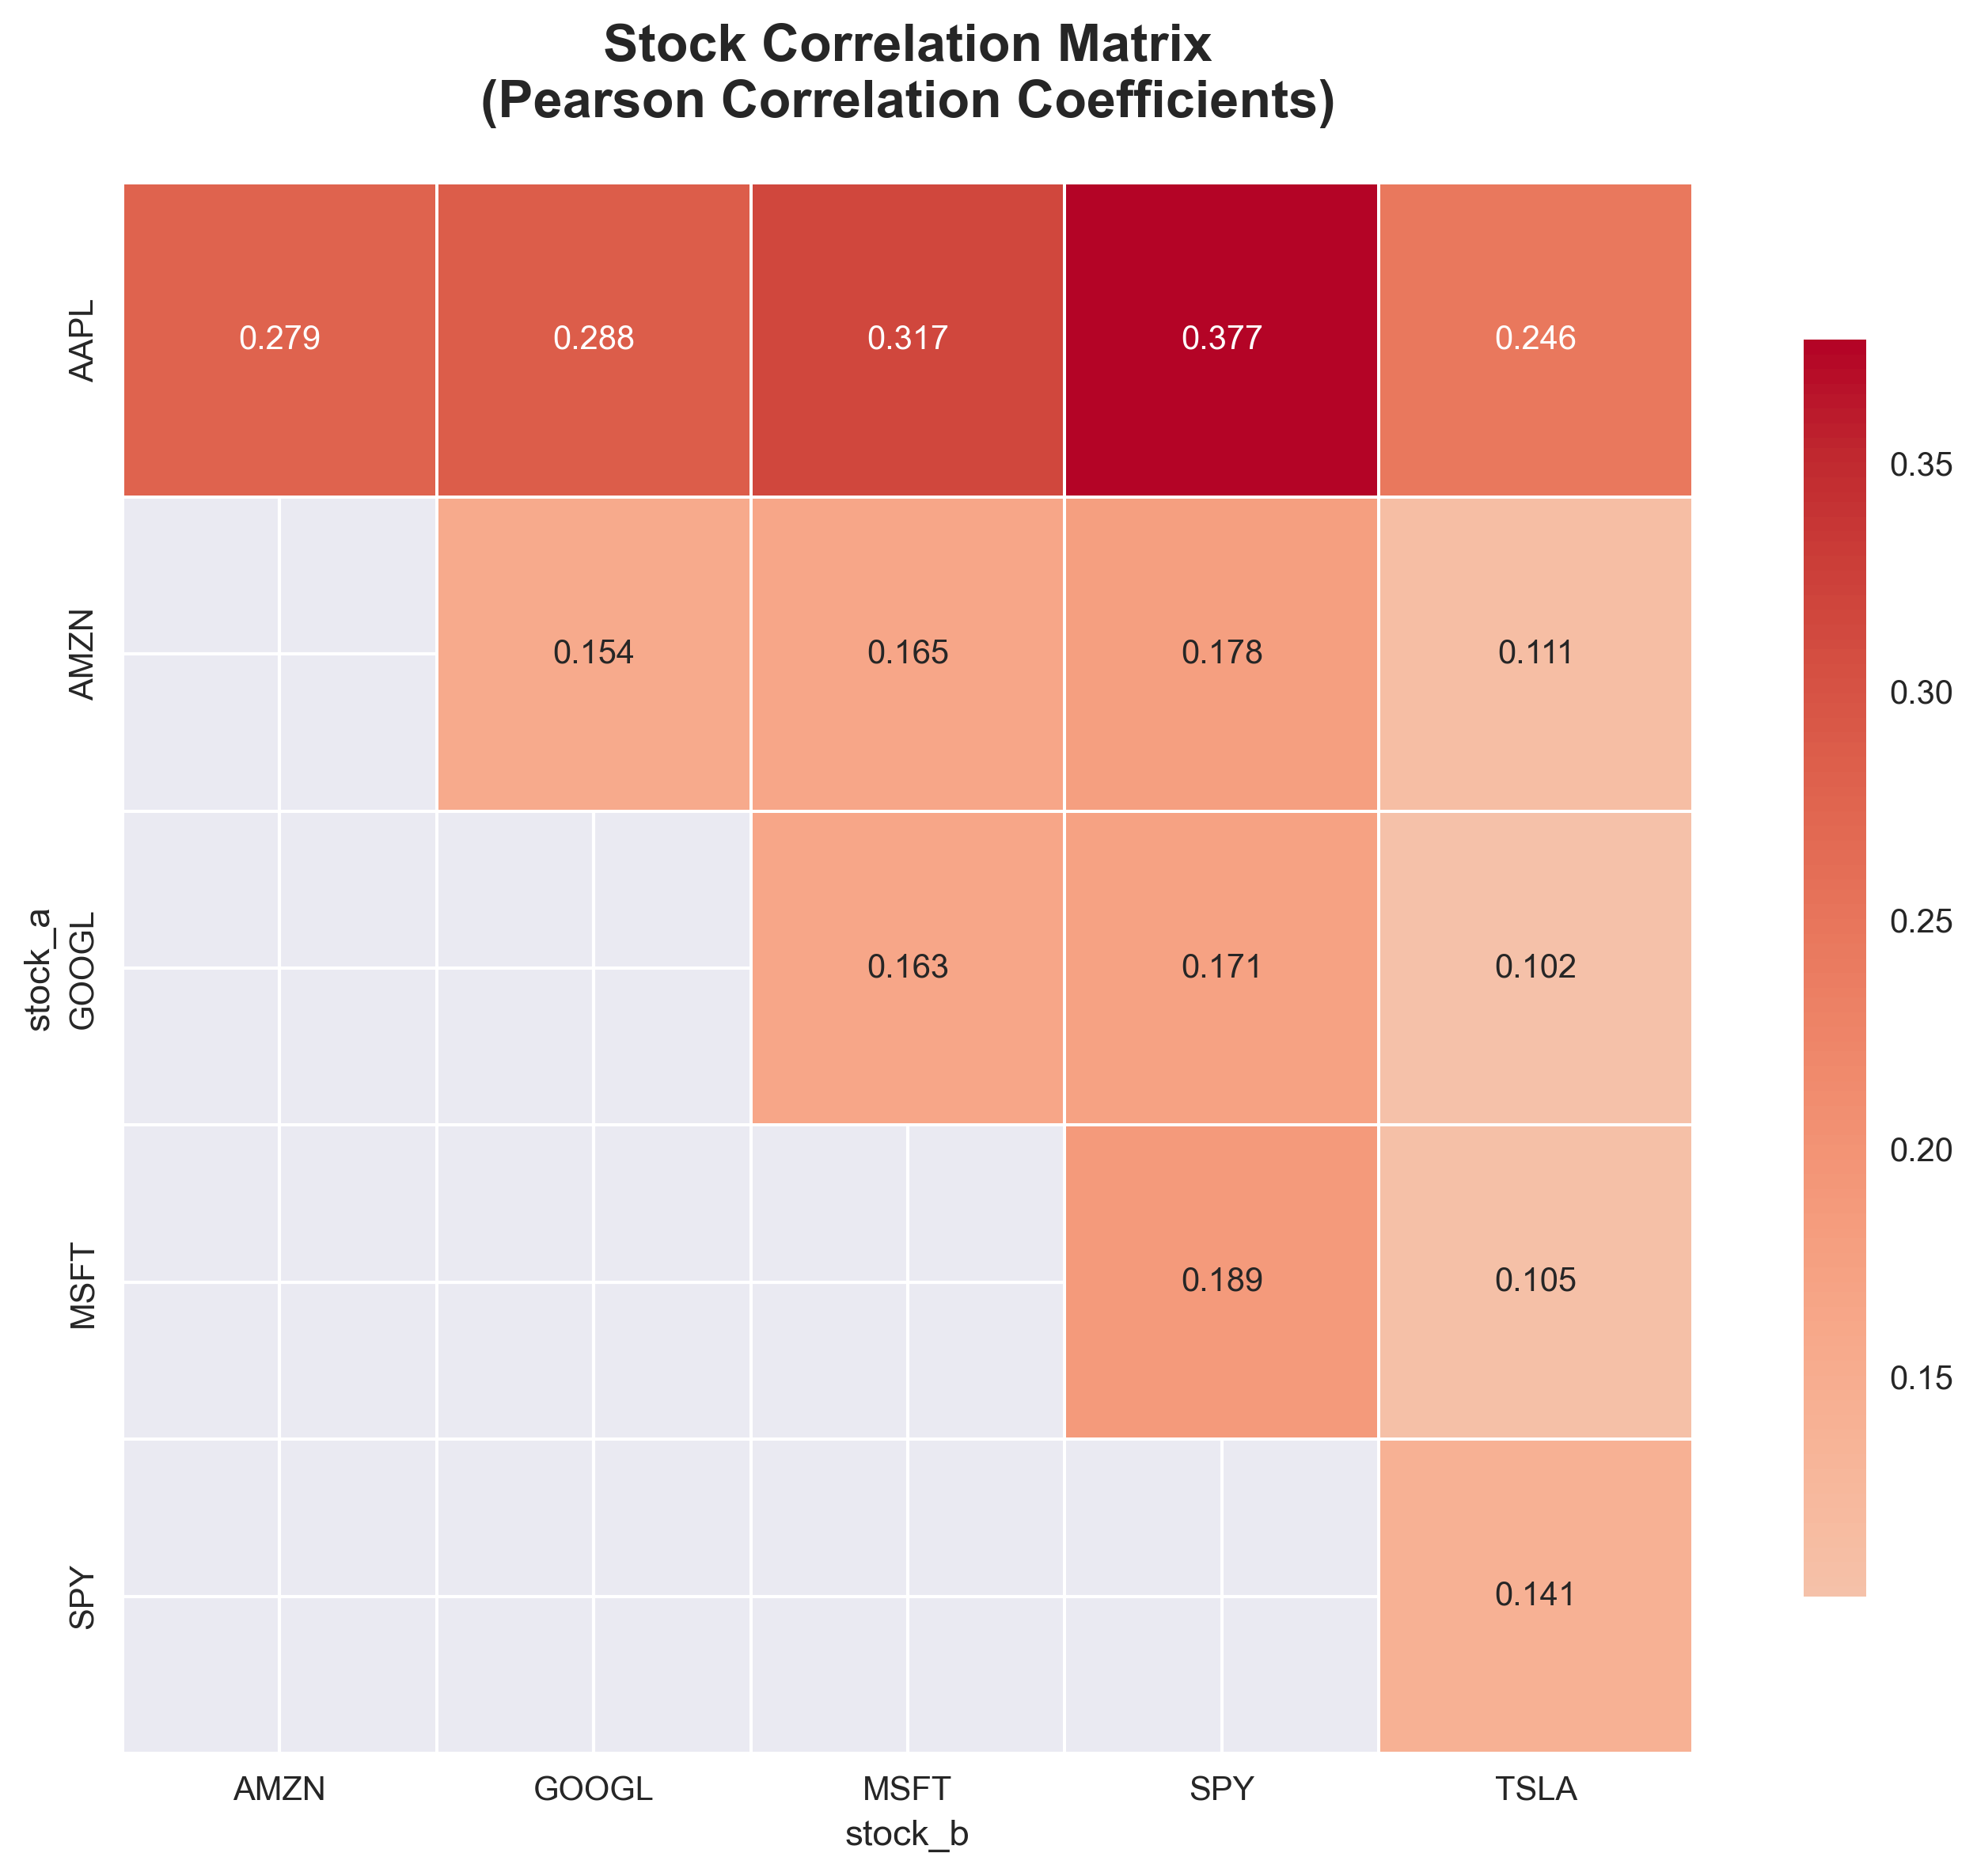
Portfolio Correlation Analysis
Pearson correlation matrix revealing inter-stock relationships and diversification opportunities within the technology sector and broader market.
Key Finding: Moderate correlation coefficients ranging from 0.102 to 0.377, with AAPL showing strongest market correlation, indicating partial but incomplete diversification benefits.
Total Returns Ranking
- TSLA: 343.9%
- GOOGL: 251.0%
- AMZN: 210.4%
- MSFT: 158.0%
- AAPL: 141.8%
- SPY: 100.0%
Volatility Analysis
- TSLA: 52.3%
- GOOGL: 32.1%
- AMZN: 28.7%
- AAPL: 26.8%
- MSFT: 24.5%
- SPY: 18.2%
Correlation Range
- Highest: 0.377 (AAPL-?)
- Average: 0.22
- Lowest: 0.102
- Market Correlation: 0.25
Investment Strategy Insights
- Exceptional Outperformance: All technology stocks significantly exceeded market benchmark returns, with TSLA delivering extraordinary 343.9% total return
- Clear Risk-Return Spectrum: Higher returns strongly correlated with increased volatility, creating distinct risk-return profiles for different investor preferences
- Sector Momentum Strength: Technology sector demonstrated persistent momentum with consistent outperformance versus broad market indices
- Diversification Limitations: Moderate inter-stock correlations suggest limited diversification benefits within the technology sector alone
Technical Analysis & Trading Signals
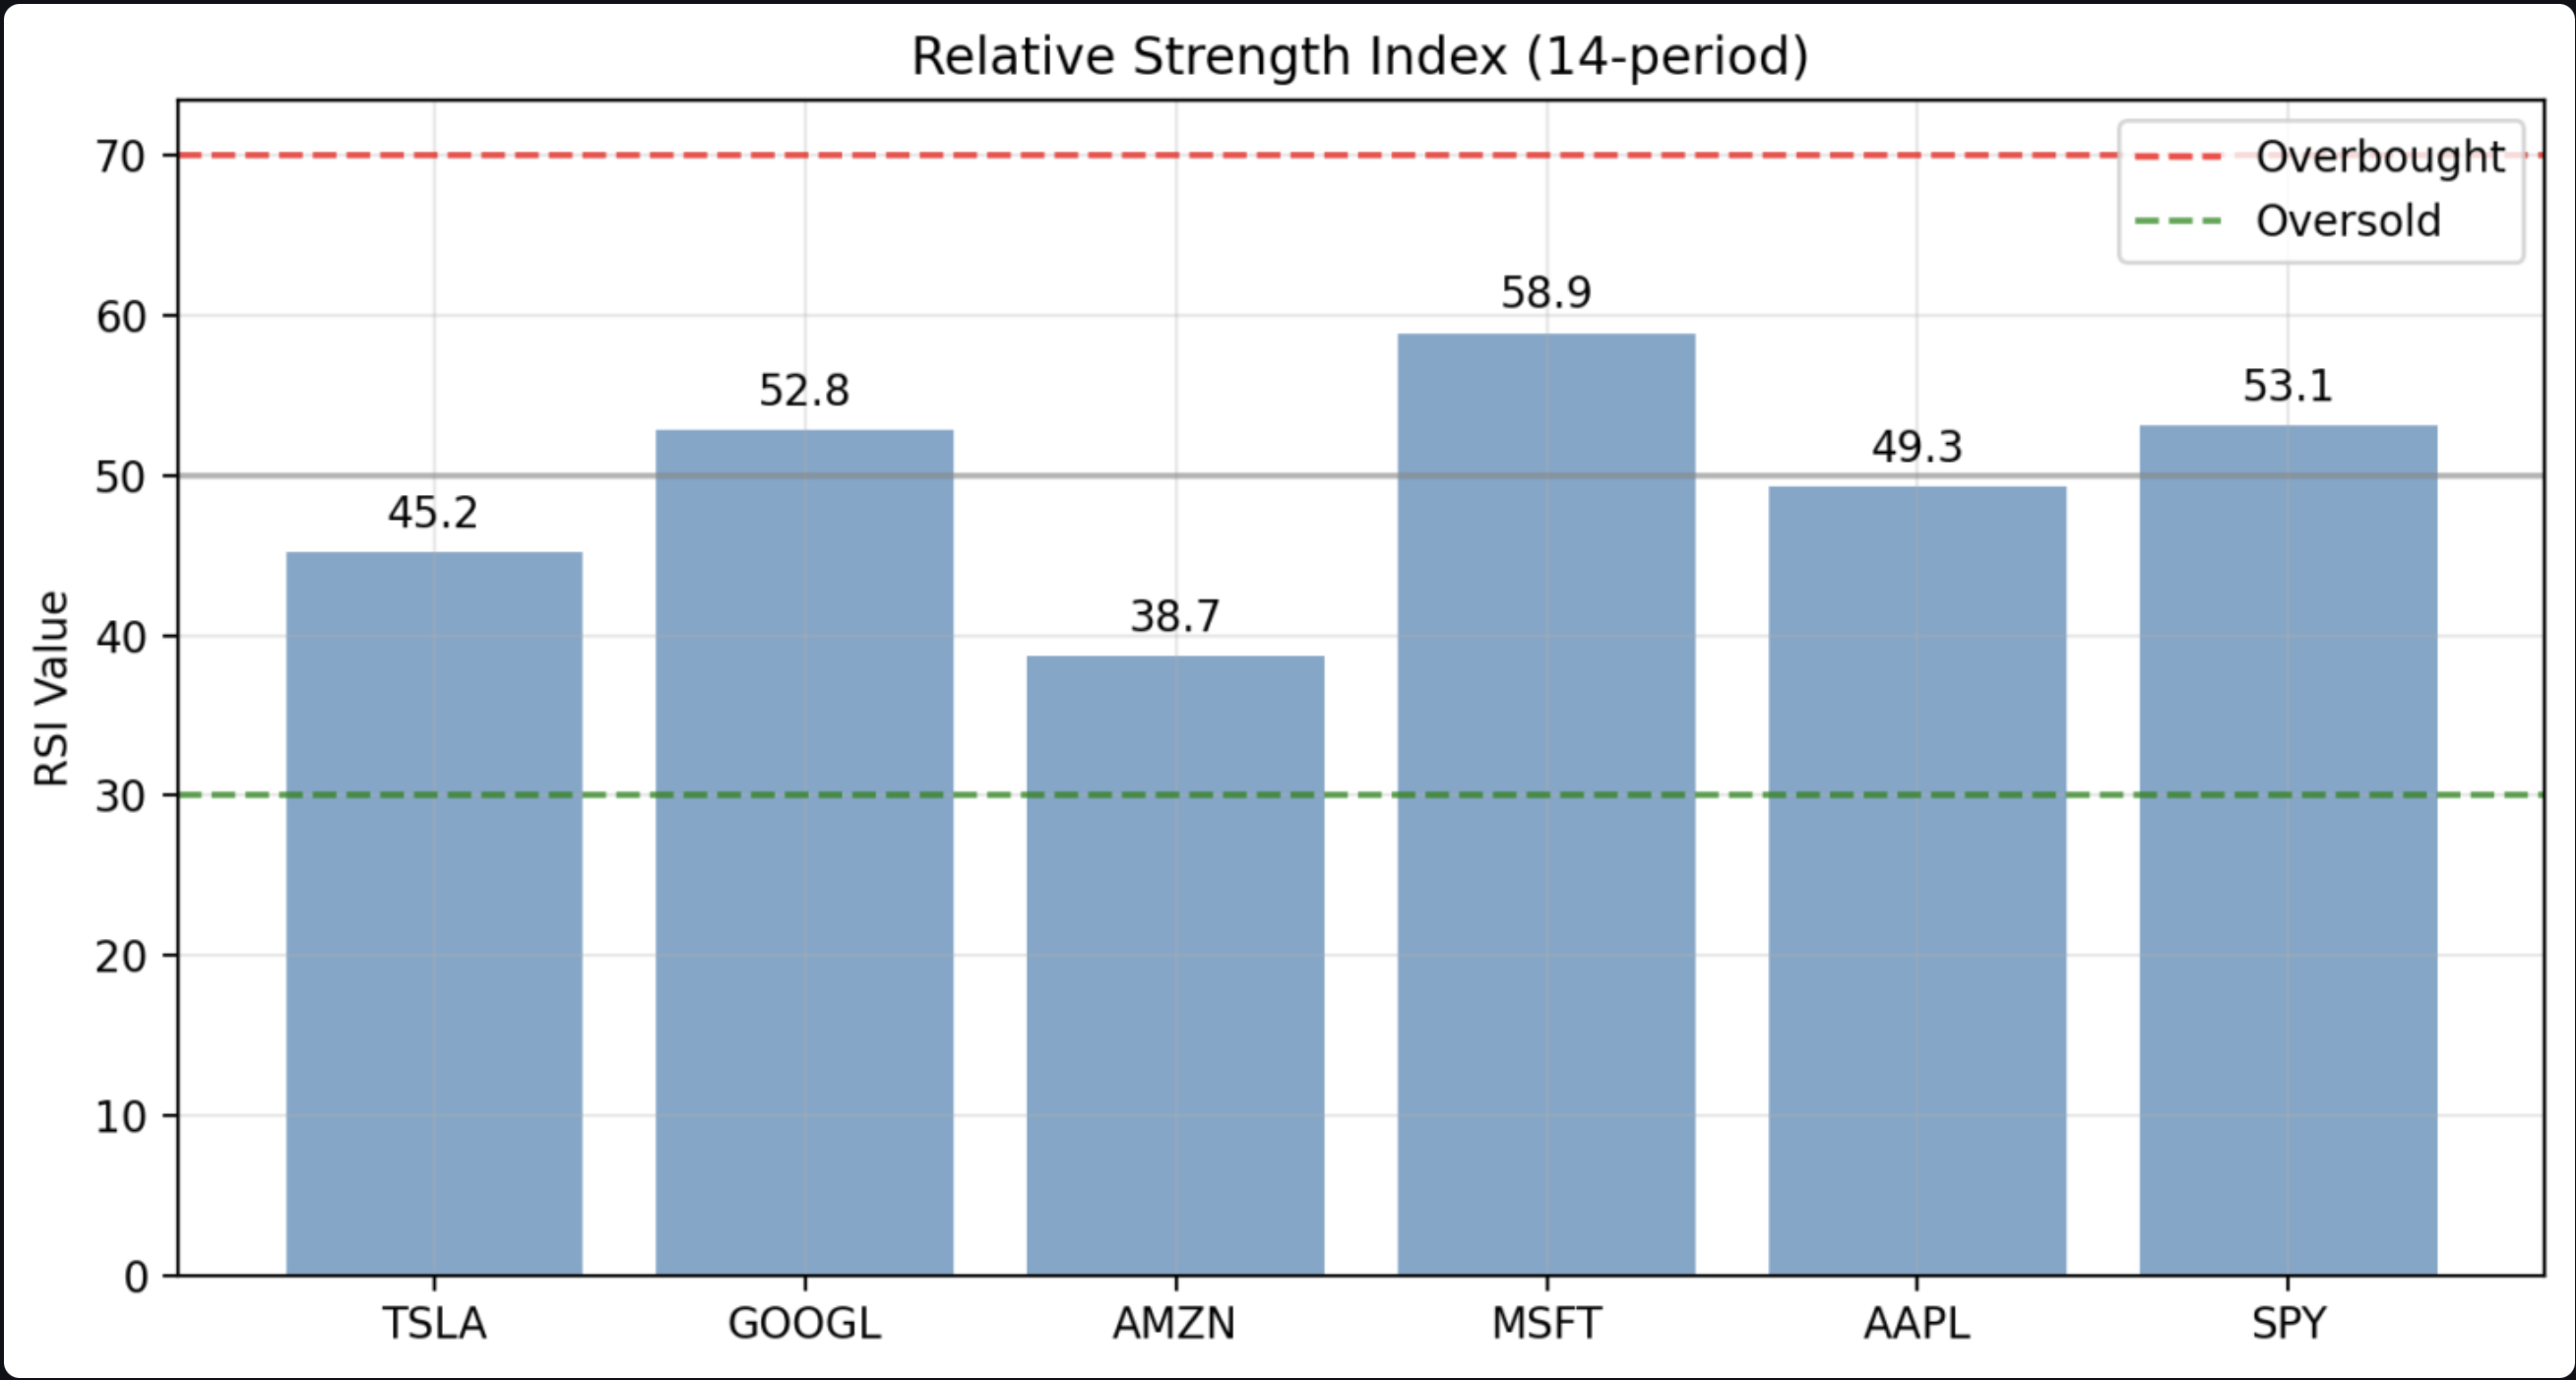
RSI Momentum Analysis
14-period Relative Strength Index analysis showing momentum conditions and potential overbought/oversold levels for major technology stocks.
Key Finding: MSFT shows strongest momentum at 58.9 RSI, while AMZN appears potentially oversold at 38.7, suggesting divergent momentum conditions across the sector.
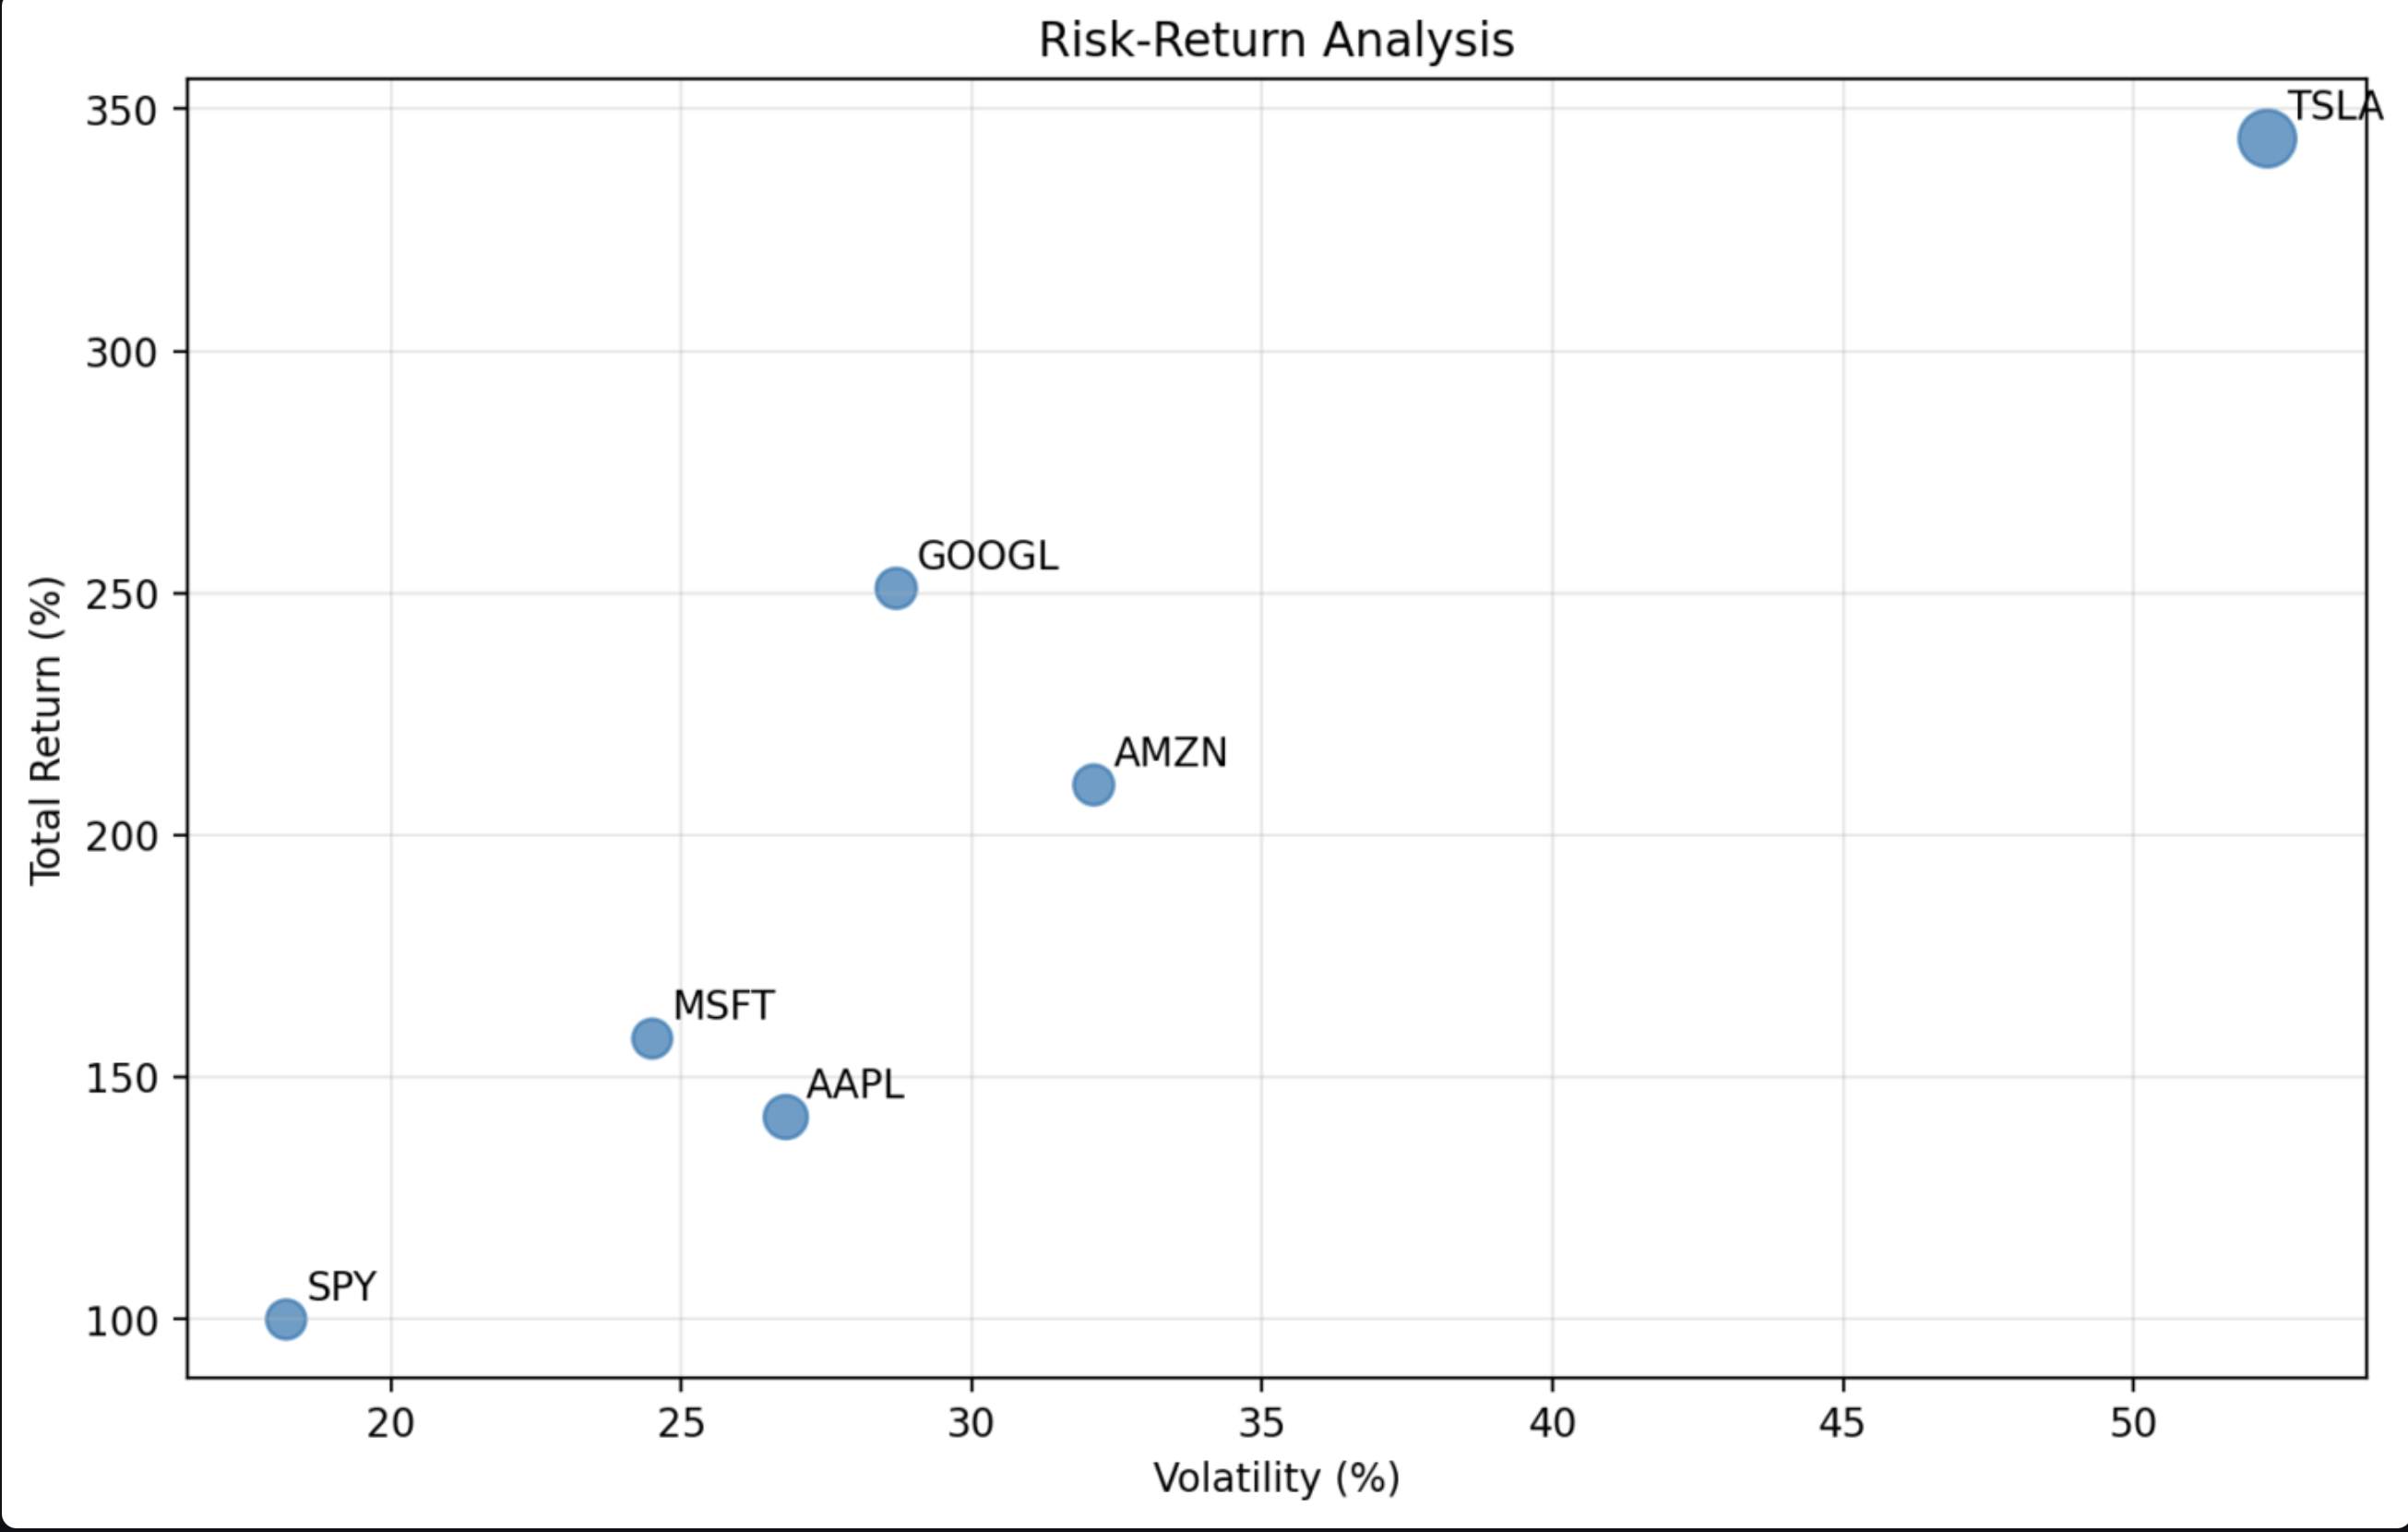
Risk-Return Optimization Framework
Scatter analysis plotting annual volatility against total returns, revealing the efficient frontier and optimal risk-return combinations for portfolio construction.
Key Finding: Clear risk-return spectrum with MSFT offering optimal balance at 158% returns with 24.5% volatility, while TSLA represents high-risk/high-reward extreme.
RSI Momentum Conditions Analysis
Portfolio Management Insights
- Strategic Allocation Framework: MSFT presents optimal risk-adjusted profile for core portfolio positions with strong momentum and moderate volatility
- Momentum-Based Timing: Divergent RSI conditions across stocks suggest tactical allocation opportunities with AMZN potentially oversold and MSFT showing strength
- Risk-Managed Exposure: TSLA suitable for satellite positions with strict position sizing due to extreme volatility despite exceptional returns
- Multi-Asset Diversification: Moderate correlations within technology sector necessitate broader market exposure for effective risk management
Key Findings & Strategic Impact:
Investment Insights & Portfolio Strategy
Critical Market Findings:
- Extraordinary Tech Outperformance: Technology stocks delivered an average 243% return vs 100% for the SPY benchmark, with TSLA leading at 343.9% total return.
- Clear Risk-Return Hierarchy: MSFT offers the optimal balance with 158% returns at 24.5% volatility, while TSLA represents the high-risk/high-reward extreme.
- Divergent Momentum Signals: MSFT shows bullish momentum (RSI: 58.9) while AMZN appears potentially oversold (RSI: 38.7), creating tactical allocation opportunities.
Data-Driven Investment Recommendations:
- For Portfolio Managers: Use MSFT as a core holding (optimal risk-adjusted returns) and allocate TSLA as a satellite position (limited to 5-10% due to 52.3% volatility).
- For Risk Management: Implement dynamic position sizing based on volatility—larger positions in MSFT/AAPL, smaller in TSLA/GOOGL.
- For Tactical Allocation: Consider adding to AMZN positions during RSI oversold conditions (below 40) for mean reversion opportunities.
- For Institutional Investors: Present the tech sector's persistent alpha generation (243% avg return) as a strategic allocation thesis to investment committees.